News
Where are the UK's worst drivers?
Speeding, collision and insurance offence hotspots
Ryan Barham
Last updated: 03/06/2026
Ryan Barham
Last updated: 03/06/2026
We all know driving can be a stressful experience with roadworks, traffic and the behaviour of other drivers causing issues. But just where are the UK’s worst drivers?
New Tempcover research [1] has examined the following local authority and police force data to find out which areas have the most:
This data only reflects reported offences, so it’s possible there may have been more issues on the roads in each location.
Before we dig deeper into these results, it’s worth taking a little time to acknowledge that road safety is a shared responsibility between national and local governments, law enforcement and road users.
According to local authority data, these areas are estimated to have the highest proportion of drivers with at least 1 penalty point on their licence.
Local authorities in Devon & Cornwall took up 8 of the top 15 destinations for drivers with at least one penalty point. The figures suggest it’s easy to get caught out in these areas, so following the rules of the road and driving sensibly is key—otherwise, you could face a fixed penalty notice or points on your licence.
You can receive between 3 and 11 penalty points for different driving offences, from using a mobile phone at the wheel to speeding or driving without insurance. If you reach 12 points within three years, you could face a driving ban.
However, for new drivers, the rules are stricter. If you accumulate 6 points within the first two years of passing your test, your licence can be revoked.
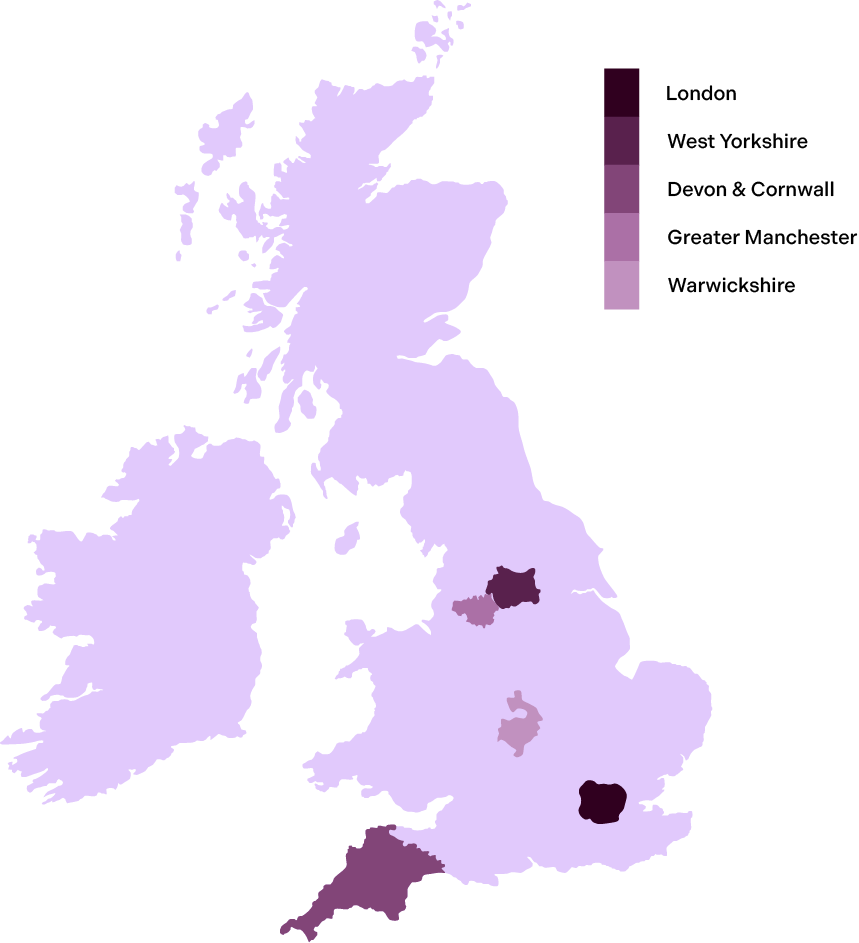
Driving without insurance remains a significant issue across England and Wales, with some police force areas recording far higher numbers of offences than others in 2024.
London stands out with the Metropolitan Police recording 11,675 offences, the highest of all the police forces included in the research by a substantial distance. The top five is completed by other areas that still record notable levels of offences:
Driving without insurance is a serious offence. Even if it’s unintentional, you could face:
If taken to court, you could also face unlimited fines, driving disqualification, and a criminal record.
It’s always worth checking if you're insured to drive a car, especially if you’re borrowing someone else’s vehicle.
A single lapse in judgement can result in you getting points on your licence - which in turn will affect your risk profile, meaning you’re likely to end up paying more for future insurance policies.
To put your mind at ease, you can take out temporary car insurance. This comprehensive coverage is flexible to your needs and available from 1 hour to 28 days.
Speed limit offences are more frequently recorded in areas with higher traffic volumes and greater levels of enforcement activity, which can naturally result in more drivers being caught compared to less populated regions.
In 2024, London recorded the highest number by a significant margin, with 439,970 offences logged. The following four areas also had a high number of speeding offences.
Beyond the top five, many other police force areas still recorded tens of thousands of offences, highlighting how widespread speeding remains across the country.
If you’re caught speeding, you could face the following penalties:
You could also be invited to attend a speed awareness course.
While speeding dominates the highest number of fixed penalty notices (FPNs) in 2024, removing it from the dataset reveals a wider range of other motoring offences being recorded across police force areas.
The next most frequently recorded offences include a mix of traffic compliance, documentation, and driving behaviour issues.
London appears repeatedly across several of these categories, including:
Outside London, other police force areas also appear across some of the most common offences.
Surrey records 8,562 offences for neglect of traffic directions, while Greater Manchester (7,807) and Leicestershire (7,248) also feature among the higher figures for this offence.
West Yorkshire also appears in the dataset, with 5,949 careless driving offences recorded.
This data shows how drivers can be penalised for a range of motoring offences, not just speeding.
It’s important to take care in all aspects of driving, from following traffic directions to avoiding distractions such as mobile phone use, even in slow-moving or stationary traffic.
Nobody wants to be involved in a car accident, but they are a reality of the road. According to local authority data, these five areas saw the highest number of collisions during 2024:
This is likely driven by higher traffic volumes and more heavily used road networks, which increase the risk of collisions.
On the flip side, these areas had the fewest collisions over the same 12 months:
All of these are remote locations (Comhairle nan Eilean Siar is based in Stornoway on the Isle of Lewis and Clackmannanshire, often referred to as ‘The Wee County’, is the smallest historic county and council area in Britain), which means fewer vehicles on the road. Less congestion makes it easier for drivers to avoid incidents.
According to Brake, the UK road safety charity, an average of five people die and 79 are injured on a UK road every day - that’s someone being killed or seriously injured every 17 minutes.
Sadly, some local authority areas recorded the highest number of fatalities resulting from road collisions over a 12-month period:
The higher figures in these local authorities may be linked to the faster-moving roads, such as A-roads, alongside other factors including traffic conditions and road layouts.
On a more positive note, there were several locations that had no road-related fatalities over the 12-month period:
This list includes both remote locations and highly controlled urban zones like Harrow and Lewisham, which typically have lower speed limits and a range of traffic calming measures that may contribute to reduced collision severity.
With all this information, you might be wondering what actually leads to somebody being called a ‘bad driver’.
We all may make mistakes while driving, but some are completely unavoidable and can lead to the driver being penalised - or harming themselves and/or other road users.
Breaking traffic violations, driving too fast and not paying attention to the rules of The Highway Code are just some of the most dangerous driving offences. These can lead to substantial penalties for the driver involved.
When dealing with aggressive or temperamental drivers, you should try and remain calm. Keep your distance - they will no longer be your problem if they speed off - and importantly, do not retaliate in any way that could provoke them.
You would not want to end up on any of the above lists due to a misjudged ‘revenge’ attempt.
Claire Wills-Mckissick, temporary car insurance expert, offers the following tips for making sure you’re not seen as one of the UK’s ‘worst’ drivers:
“Wherever you live, the rules of the road remain the same. Here’s how you can avoid some of the most common driving offences:
Whether you’re driving in a safe or high risk area, it’s important to stay safe. If the worst were to happen, you need to ensure your insurance is valid.”
Remember, you can check your driving licence information and history on the government’s website.
[1] To compare driving in different parts of the country, we look at road collisions, road deaths, recorded offences for speeding and insurance, and the % of drivers with penalty points for each police force area in England and Wales.
For collisions and deaths, we took the published numbers for local authorities and combined them by summing the total for all authorities in a police force area - a rate was then calculated using DfT figures on traffic volumes within the local authorities within that police force area.
Penalty points statistics were published at postcode outcode level (e.g. AB10, E14)- to calculate the total we summed the figure from each outcode in a police force area. Where outcodes fell into more than one police force area we estimated the number of drivers that fell into each police force area by analysing the % of postcodes within the outcode that fall into that area.
Offences were published at police force level - the published stats note that data from Norfolk and Suffolk, and from South Wales, Gwent, Dyfed-Powys should be combined due to various data collection issues. We combined these figures here and for all other data points for consistency.
The City of London police force area was excluded as there are less than 1000 driving licences registered within that area.
Road collision rates by severity and LA
Reported road casualty rates by severity and LA
Roads policing offences by police force area
Traffic volumes
https://roadtraffic.dft.gov.uk/downloads#local-authority-level
Driving licence data
https://www.data.gov.uk/dataset/d0be1ed2-9907-4ec4-b552-c048f6aec16a/driving-licence-data
https://www.myfourwheels.co.uk/news/the-worst-drivers-in-the-uk-revealed
https://www.gov.uk/penalty-points-endorsements/endorsement-codes-and-penalty-points
https://www.police.uk/advice/advice-and-information/rs/road-safety/driving-offences/
https://www.cps.gov.uk/types-crime/driving-offences
https://www.highwaycodeuk.co.uk/penalty-table.html
https://www.rac.co.uk/drive/advice/legal/driving-offences/
https://www.gov.uk/view-driving-licence
https://www.brake.org.uk/get-involved/take-action/mybrake/knowledge-centre/uk-road-safety
https://www.highwaycodeuk.co.uk/uploads/3/2/9/2/3292309/the_official_highway_code_-_10-04-2025_2.pdf
If you see someone driving dangerously, you can report them to your local police force via their official website or via 101. If they’re driving a company vehicle, you can also notify the company in question.
According to Tempcover’s data, the safest drivers in the UK are in Cleveland in the North East with only 873 speed limit offences per billion miles and 173 road collisions per billion miles.
In the UK, the legal term "reckless driving" was replaced by "dangerous driving" under the Road Traffic Act 1991, shifting the focus from the driver's state of mind to the actual standard of driving.
A person who causes the death of another person by driving a mechanically propelled vehicle dangerously on a road or other public place is guilty of an offence.
2. Dangerous driving.
A person who drives a mechanically propelled vehicle dangerously on a road or other public place is guilty of an offence.
Driving offences can be criminal convictions, but this depends on the level of the offence. Fixed penalty notices for issues like parking violations do not constitute criminal convictions but endorsable motoring offences for the following can be:
Serious motoring offences like the below will result in criminal convictions, which will appear on your criminal record and affect employment opportunities, insurance costs, travel arrangements and more:
Standard or Enhanced DBS checks generally focus on specific criminal records, However, serious driving offences that result in a criminal conviction will appear on these checks. Minor motoring offences, such as speeding tickets, typically do not appear on a DBS.
Related tags:
Temporary Car InsuranceWe also currently hold an ‘Excellent’ rating on Trustpilot with over 50,000 reviews.